How to Calculate Shopify Profit After Ads, COGS, Fees, and Refunds

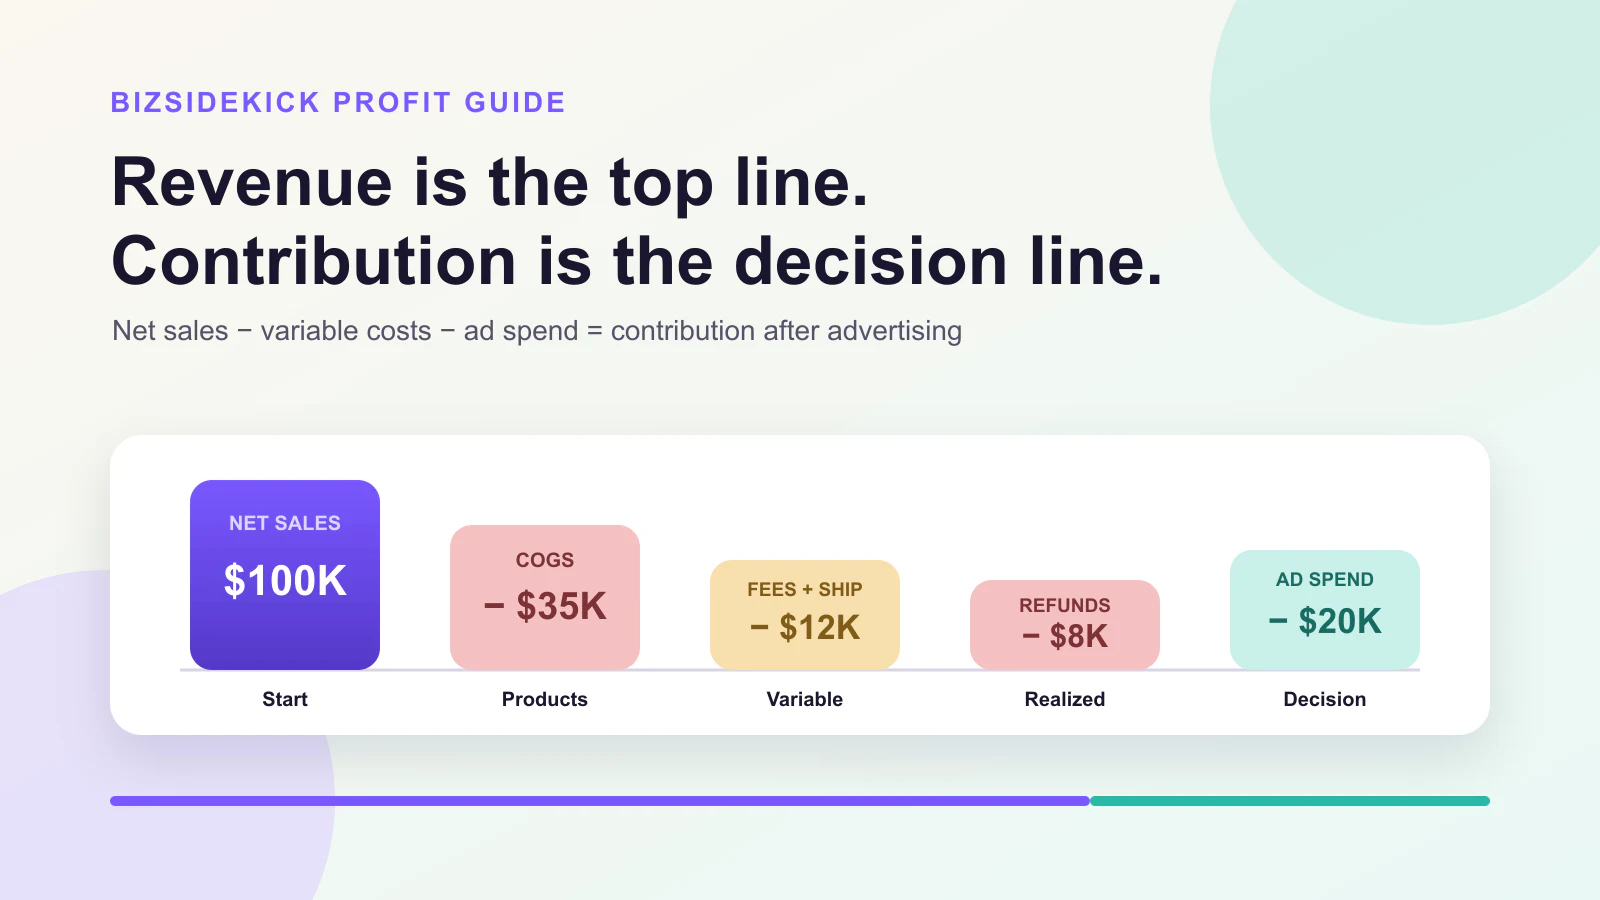
The quick answer: calculate contribution, not “revenue minus ads”
To decide whether paid growth is creating operating value, use a defined contribution formula:
Realized net sales
− product cost
− payment and transaction fees
− fulfillment and shipping subsidy
− return-related variable costs
− advertising spend
= contribution after advertising
This is not complete accounting net profit. It does not automatically include payroll, rent, software, financing, tax obligations, overhead allocation, or every cost in your books. It is a practical decision line for questions such as:
- Can this product absorb more paid traffic?
- Did a high reported ROAS produce value after refunds?
- Which missing cost prevents a confident budget recommendation?
- Should the team scale, hold, cut, or investigate?
The most important rule is simple:
If a material cost is missing, label the result incomplete and stop before recommending a scale-up.
A precise-looking profit number built on blank COGS or delayed refunds is more dangerous than an honest range.
Why Shopify revenue, ad-platform ROAS, and payouts differ
Operators often place three numbers beside each other and expect them to match:
- Shopify sales
- Advertising-platform attributed revenue
- Payment payouts
They describe different events.
Shopify's finance reports distinguish gross sales, net sales, and total sales. Shopify defines net sales as gross sales minus discounts and sales reversals. Total sales then includes items such as taxes, shipping, and fees. Review the current definitions in Shopify's finance reports documentation.
An advertising platform reports revenue it attributes to ad interactions under its own window and model. That is useful for channel diagnosis and optimization, but it is not a second pool of realized store revenue.
A payout report describes funds transferred through a payment processor, with its own timing and adjustments. Shopify explicitly separates payout reconciliation from revenue reporting. See Shopify's payout reconciliation guide.
The numbers are not interchangeable:
| Number | The question it answers | Do not use it alone for |
|---|---|---|
| Shopify realized sales | What commerce outcome occurred? | Channel credit or complete profit |
| Contribution | Did the order or segment create operating value after defined variable costs? | Statutory accounts or all-company net profit |
| Channel-attributed revenue | Which marketing interactions deserve diagnostic credit? | Additive store revenue |
| Payment payout | What funds arrived through this processor? | Sales performance for the same date window |
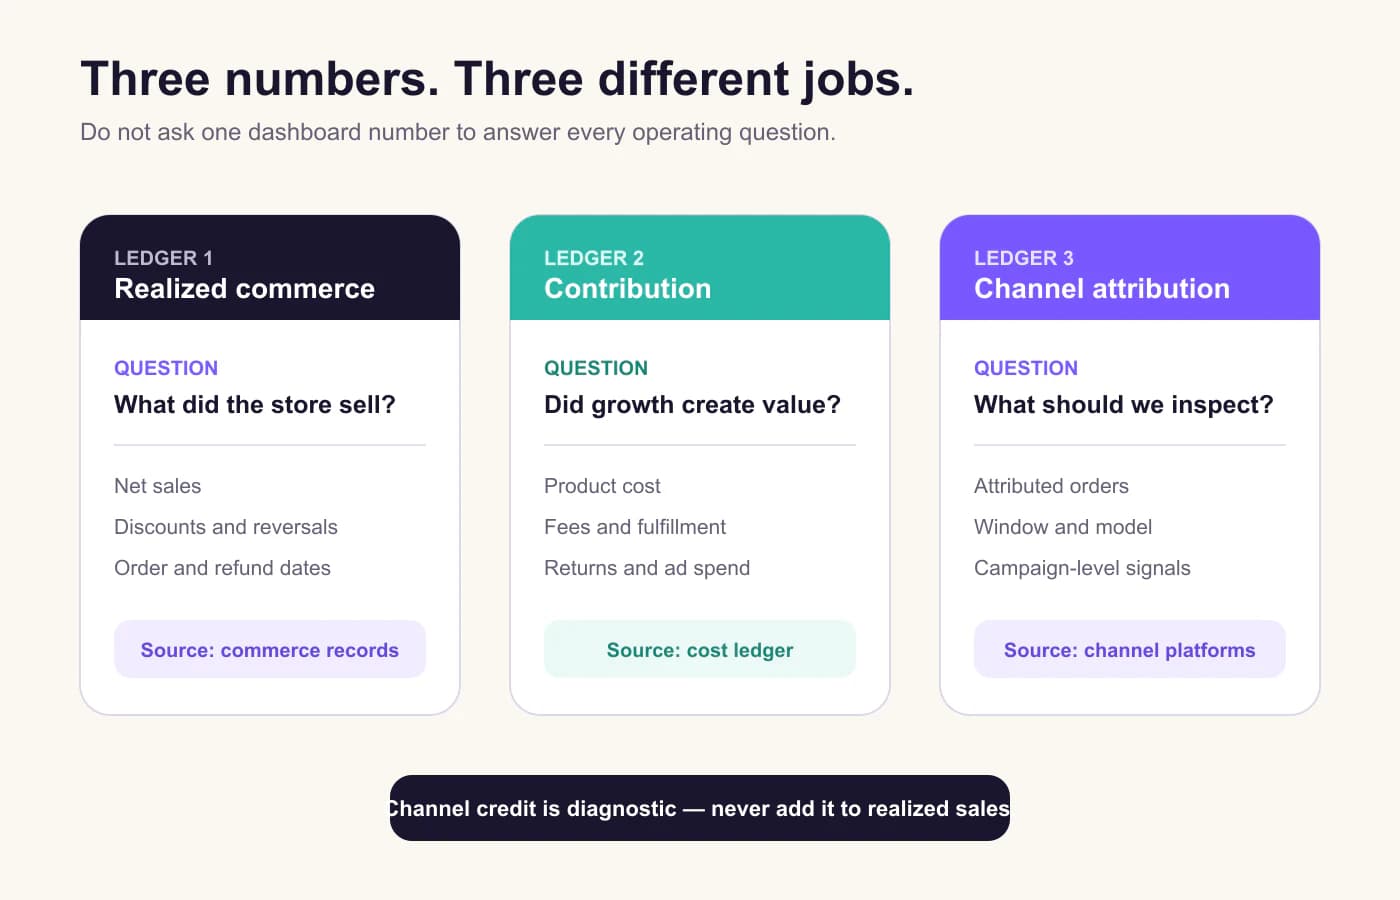
The accounting system remains the owner of formal financial statements. The contribution ledger is an operating bridge between commerce, costs, and advertising decisions.
Step 1: choose one revenue definition
Do not begin with the largest revenue number available. Begin with the question.
For a paid-growth review, a defensible starting point is usually realized net sales for the selected orders and date basis. Write the contract down:
- Order states included
- Cancellation and refund treatment
- Discount treatment
- Tax treatment
- Shipping charged to the customer
- Currency and conversion rule
- Date basis: order date, transaction date, or another defined event
- Time zone
The correct choice depends on the decision. A cash forecast may care about payout timing. A product contribution view may include shipping revenue and subtract fulfillment cost. A marketing review may need both order-date and refund-adjusted views.
The mistake is not choosing one universal metric. The mistake is using a metric without saying what it includes.
Keep pass-through amounts explicit
Taxes collected can increase a dashboard total without increasing operating margin. Customer-paid shipping can offset fulfillment cost, but the two amounts are not necessarily equal. Treat them as separate lines when they materially affect the decision:
Merchandise net sales
+ retained shipping revenue
− fulfillment and carrier cost
Do not hide both in a generic “revenue” row.
Decide how refunds enter the window
A refund can occur days or weeks after the original order. Two valid views can therefore disagree:
- Order-cohort view: Assign later refunds back to the original order cohort.
- Transaction-period view: Record the refund when it occurs.
Use the cohort view to judge acquisition quality and product economics. Use the transaction-period view for operational cash and current-period reconciliation. If you switch between them without a label, historical profitability will appear to change for mysterious reasons.
Step 2: build the complete variable-cost ledger
The useful ledger names the source, definition, date basis, completeness, and owner for every input.
| Input | Preferred source | Completeness check | Decision risk when missing |
|---|---|---|---|
| Net sales | Shopify order/finance data | Discounts and reversals included | Overstates realized value |
| Product cost | SKU cost, ERP, or approved cost file | Coverage by sold unit | Makes gross profit unusable |
| Payment fees | Processor transaction records | All processors included | Overstates contribution |
| Fulfillment | 3PL, carrier, or approved rate table | Actual or labeled estimate | Hides expensive orders |
| Return cost | Refunds plus handling/restocking policy | Refund lag considered | Makes recent cohorts look better |
| Ad spend | Connected advertising accounts | Same currency and date contract | Breaks paid-growth decision |
Product cost
Shopify profit reports use the cost recorded for products to calculate gross profit and margin. Shopify warns that missing cost data creates gaps in profit reporting. It also describes gross profit as net sales minus product cost. Review the exact behavior in Shopify's profit reports documentation.
Cost coverage should be a visible quality metric:
COGS coverage = sold units with an approved cost ÷ total sold units
If high-revenue products have no cost, a high overall percentage can still be misleading. Add revenue-weighted coverage or list the largest missing SKUs.
For costs that change by purchase order or batch, a static current cost per item may not reproduce historical economics. Use the merchant's approved ERP or accounting method when that distinction matters.
Payment and transaction fees
Include fees from every processor used in the selected orders. Shopify Payments data alone will not cover a third-party gateway. Buy-now-pay-later, international, currency-conversion, and chargeback costs may follow different schedules.
Use actual transaction fees when available. If you use an estimate, label the rate, fixed component, processor scope, and date verified.
Fulfillment and shipping subsidy
The customer may pay $5 for shipping while the merchant pays $9 to the carrier and 3PL. The variable cost is not zero and the subsidy is not simply the carrier bill.
Use a consistent definition:
shipping contribution = retained customer shipping − variable fulfillment cost
Include pick-and-pack, postage, packaging, and any per-order 3PL fee that changes with the order. Keep warehouse overhead separate unless the operating decision intentionally allocates it.
Refunds, returns, and failed delivery
Subtract the commerce reversal and the additional variable cost:
- Refunded merchandise value
- Non-recoverable product cost
- Return shipping
- Restocking or inspection
- Reshipment
- Payment fees not recovered
Not every return has every cost. The ledger should reflect the merchant's real policy rather than a generic percentage.
Advertising spend
Use spend from the accounts and campaigns in scope, normalized to the same currency and date contract.
Do not use platform-attributed revenue as the store's realized sales line. Shopify notes that certain attribution views, including any-click analysis, can give credit to multiple channels for the same order. That can be useful inside a channel review, but combining channel credit can exceed the number of actual orders. See Shopify's marketing reports documentation.
For a whole-store operating view, compare realized contribution with total included paid-media spend. For a channel decision, keep the channel's attributed view beside the result as diagnostic evidence.
Step 3: calculate contribution by the grain of the decision
A storewide result can hide opposite outcomes.
Calculate at the smallest grain supported by reliable evidence:
- Order for detailed reconciliation
- SKU or product family for merchandising
- New versus returning customer for acquisition decisions
- Market or currency for regional operations
- Campaign or channel for budget review
- Weekly or monthly cohort for refund maturation
Avoid false precision. Campaign-level contribution is only as reliable as the mapping between orders and the campaign. If the link is weak, label the view as blended or directional.
An illustrative worked example
The following example is hypothetical. It is not a customer result.
A Shopify product generates these results for a mature weekly cohort:
| Line | Amount | Source note |
|---|---|---|
| Gross merchandise sales | $24,000 | Selected orders |
| Discounts | −$1,800 | Shopify order lines |
| Sales reversals | −$1,200 | Assigned to original cohort |
| Realized net sales | $21,000 | Defined sales line |
| Product cost | −$7,350 | 100% SKU cost coverage |
| Payment fees | −$720 | Included processors |
| Fulfillment subsidy | −$1,530 | Shipping revenue less variable cost |
| Return handling | −$300 | Cohort return costs |
| Contribution before advertising | $11,100 | 52.9% of net sales |
| Advertising spend | −$7,800 | Same currency and date contract |
| Contribution after advertising | $3,300 | 15.7% of net sales |
The platform might show a 3.0 attributed ROAS because it credited $23,400 in revenue to $7,800 of spend. The operating result still depends on realized sales and costs.
The example does not prove the platform is wrong. It shows why the platform's optimization signal cannot replace the contribution ledger.
Step 4: calculate a break-even ROAS range
A simplified break-even ROAS can be derived from the contribution margin available before advertising:
break-even ROAS = 1 ÷ pre-ad contribution margin
If contribution before advertising is 52.9% of realized net sales:
1 ÷ 0.529 ≈ 1.89
That means approximately $1.89 of the defined realized revenue is required per $1 of advertising spend to reach zero contribution after advertising under these assumptions.
It is not a universal target. It changes when any input changes:
- Product mix
- Discount depth
- New-customer share
- Refund rate
- Shipping zone
- Payment method
- Currency
- Fulfillment policy
- Attribution between campaign and order
Use a range when uncertainty is material:
| Scenario | Pre-ad contribution margin | Approximate break-even ROAS |
|---|---|---|
| Strong mix | 58% | 1.72 |
| Expected mix | 53% | 1.89 |
| Weak mix / more returns | 46% | 2.17 |
These values are illustrative calculations. Replace them with approved inputs.
A campaign reporting 2.0 ROAS might be above the expected break-even point but below the weak-case point. The correct action could be “hold and investigate mix,” not “scale” or “pause.”
Step 5: use explicit action rules
Translate the ledger into a review state:
Scale candidate
- Contribution after advertising is positive under the expected and conservative cases.
- Material cost coverage is complete.
- Refund behavior has had enough time to mature.
- The acquisition or campaign mapping is reliable enough for the decision.
- A budget ceiling and review window are defined.
Hold and monitor
- Contribution is positive but close to the uncertainty range.
- Product mix or return timing may change the result.
- Spend is still within a safe merchant-defined limit.
Reduce or stop
- Contribution remains negative after definitions are aligned.
- The result is not explained by a short timing gap.
- The proposed action isolates the affected campaign, product, or market.
- The team has reviewed customer-acquisition and longer-term considerations.
Fix data before deciding
- Material SKUs lack costs.
- Refunds are not assigned consistently.
- Ad spend is incomplete.
- Currencies or time zones are mixed.
- Channel-attributed revenue was used as realized sales.
“Fix data” is a legitimate operating outcome. It prevents a confident recommendation from being manufactured out of an incomplete ledger.
Reconcile contribution with attribution without forcing a match
Keep the two views beside each other:
| View | Use it to decide | Key boundary |
|---|---|---|
| Realized contribution | Whether the defined business activity created value | Needs complete cost and refund treatment |
| Platform attribution | What the platform should learn or what to investigate | Depends on attribution window and model |
| Blended paid efficiency | Whether total paid acquisition fits the store economics | Hides channel-level differences |
The goal is not to make every total equal. The goal is to explain why the difference exists and give each number one owner.
When the platform reports strong attributed revenue but contribution is weak, investigate:
- Product mix shifted toward lower-margin items.
- Discount or promotion cost increased.
- Refunds arrived after the platform conversion event.
- Shipping or payment costs increased.
- The platform credited orders also touched by other channels.
- New and returning customers were mixed.
- Spend or sales used different time zones.
When contribution is strong but attributed performance is weak, investigate tracking, consent, destination tagging, attribution settings, and organic or direct demand before cutting the channel.
Use the calculator, then verify the inputs
The Ad Profit Calculator is the fastest way to test your assumptions. Use it to explore how selling price, cost, fees, refunds, and ad spend change the result.
The calculator is not a substitute for input ownership. After testing:
- Replace estimates with approved source values.
- Record the date basis and currency.
- Mark missing data.
- Compare expected and conservative cases.
- Keep the proposed budget change separate from the calculation.
For related definitions, use the ecommerce KPI guide. For the diagnostic role of channel metrics, see how to track ROAS across Meta, Google, and TikTok.
Run a connected profit review in BizSidekick
BizSidekick can review authorized Shopify commerce evidence and supported connected advertising spend, show which required inputs are present or missing, and prepare a governed recommendation. It is an operations workspace, not an accounting system. Formal financial reporting remains with your approved accounting process.
Use a prompt with an explicit stopping rule:
Review Shopify realized net sales, discounts, refunds, product costs, and
supported connected ad spend for the last four complete weeks. Use one
currency and time zone. Show cost coverage and list material missing inputs.
Calculate contribution after advertising by product family and prepare
budget changes for review only when the evidence is complete. Do not change
an advertising account until I approve.
Frequently asked questions
What is Shopify profit after advertising?
For an operating paid-growth decision, calculate contribution after advertising: realized net sales minus defined variable product, payment, fulfillment, return, and advertising costs. Call it contribution unless it includes every expense required by your accounting definition of net profit.
Should I use gross sales, net sales, or total sales?
Use the metric that matches the decision and document its components. Net sales is usually a clearer starting point for merchandise performance because it reflects discounts and sales reversals. Add retained shipping or other amounts explicitly when they belong in the contribution view.
Why does my payout not match Shopify revenue?
A payout is a transfer of funds through a processor. Sales reports describe commerce activity. Timing, fees, reserves, refunds, and third-party processors can make them differ.
Is one break-even ROAS enough for the whole store?
Only as a rough estimate. Product mix, discounting, shipping, payment fees, and refund rates create different economics. Use a range and segment the threshold when the difference could change the decision.
What should happen when COGS is missing?
Mark the affected result incomplete, identify the missing SKUs and their revenue impact, and stop before recommending a scale-up. Do not silently replace a material cost with zero.
Keep reading
Continue with a guide that supports your next ecommerce decision.